


Scale & Maintain
An embedded senior team, led by a fractional CTO, that evolves the data platform with you across pipelines, integrations, quality and reliability.
How we maintain?Loading…
You already have the data — spread across meters, historians, vendor feeds, filings, and spreadsheets. We build the pipelines and data layer that turn it into something you can trust and act on. A pipeline that breaks when a source changes format. Data that doesn't reconcile between two systems. A regulatory report that still takes a person a week. Thousands of readings you can't turn into a decision.
ETL & pipelines
Meter & AMI data
Historians & time-series
Reconciliation & quality
Regulatory reporting
Data & AI
An embedded senior team, led by a fractional CTO, that evolves the data platform with you across pipelines, integrations, quality and reliability.
How we maintain?We engineer what's next: a pipeline, an integration, a data layer, a reporting flow, or AI at the core.
How we build?Make what already runs reliable — pipeline failures, data quality, reconciliation, integrations, technical debt.
How we fix?
We work with the data systems you already have
CIS, MDM, historians, meters, and vendor feeds — and build the pipelines and logic between them to make the whole thing work together.
Energy data is messy in specific ways
interval data, VEE, settlement, tag mapping, regulatory formats, fifty different state systems. We've built data infrastructure that handles it in production, so the first call starts at your problem.
We don't sell a platform, so we have no reason to talk you out of yours.
No platform bias — we build around the systems you already trust.
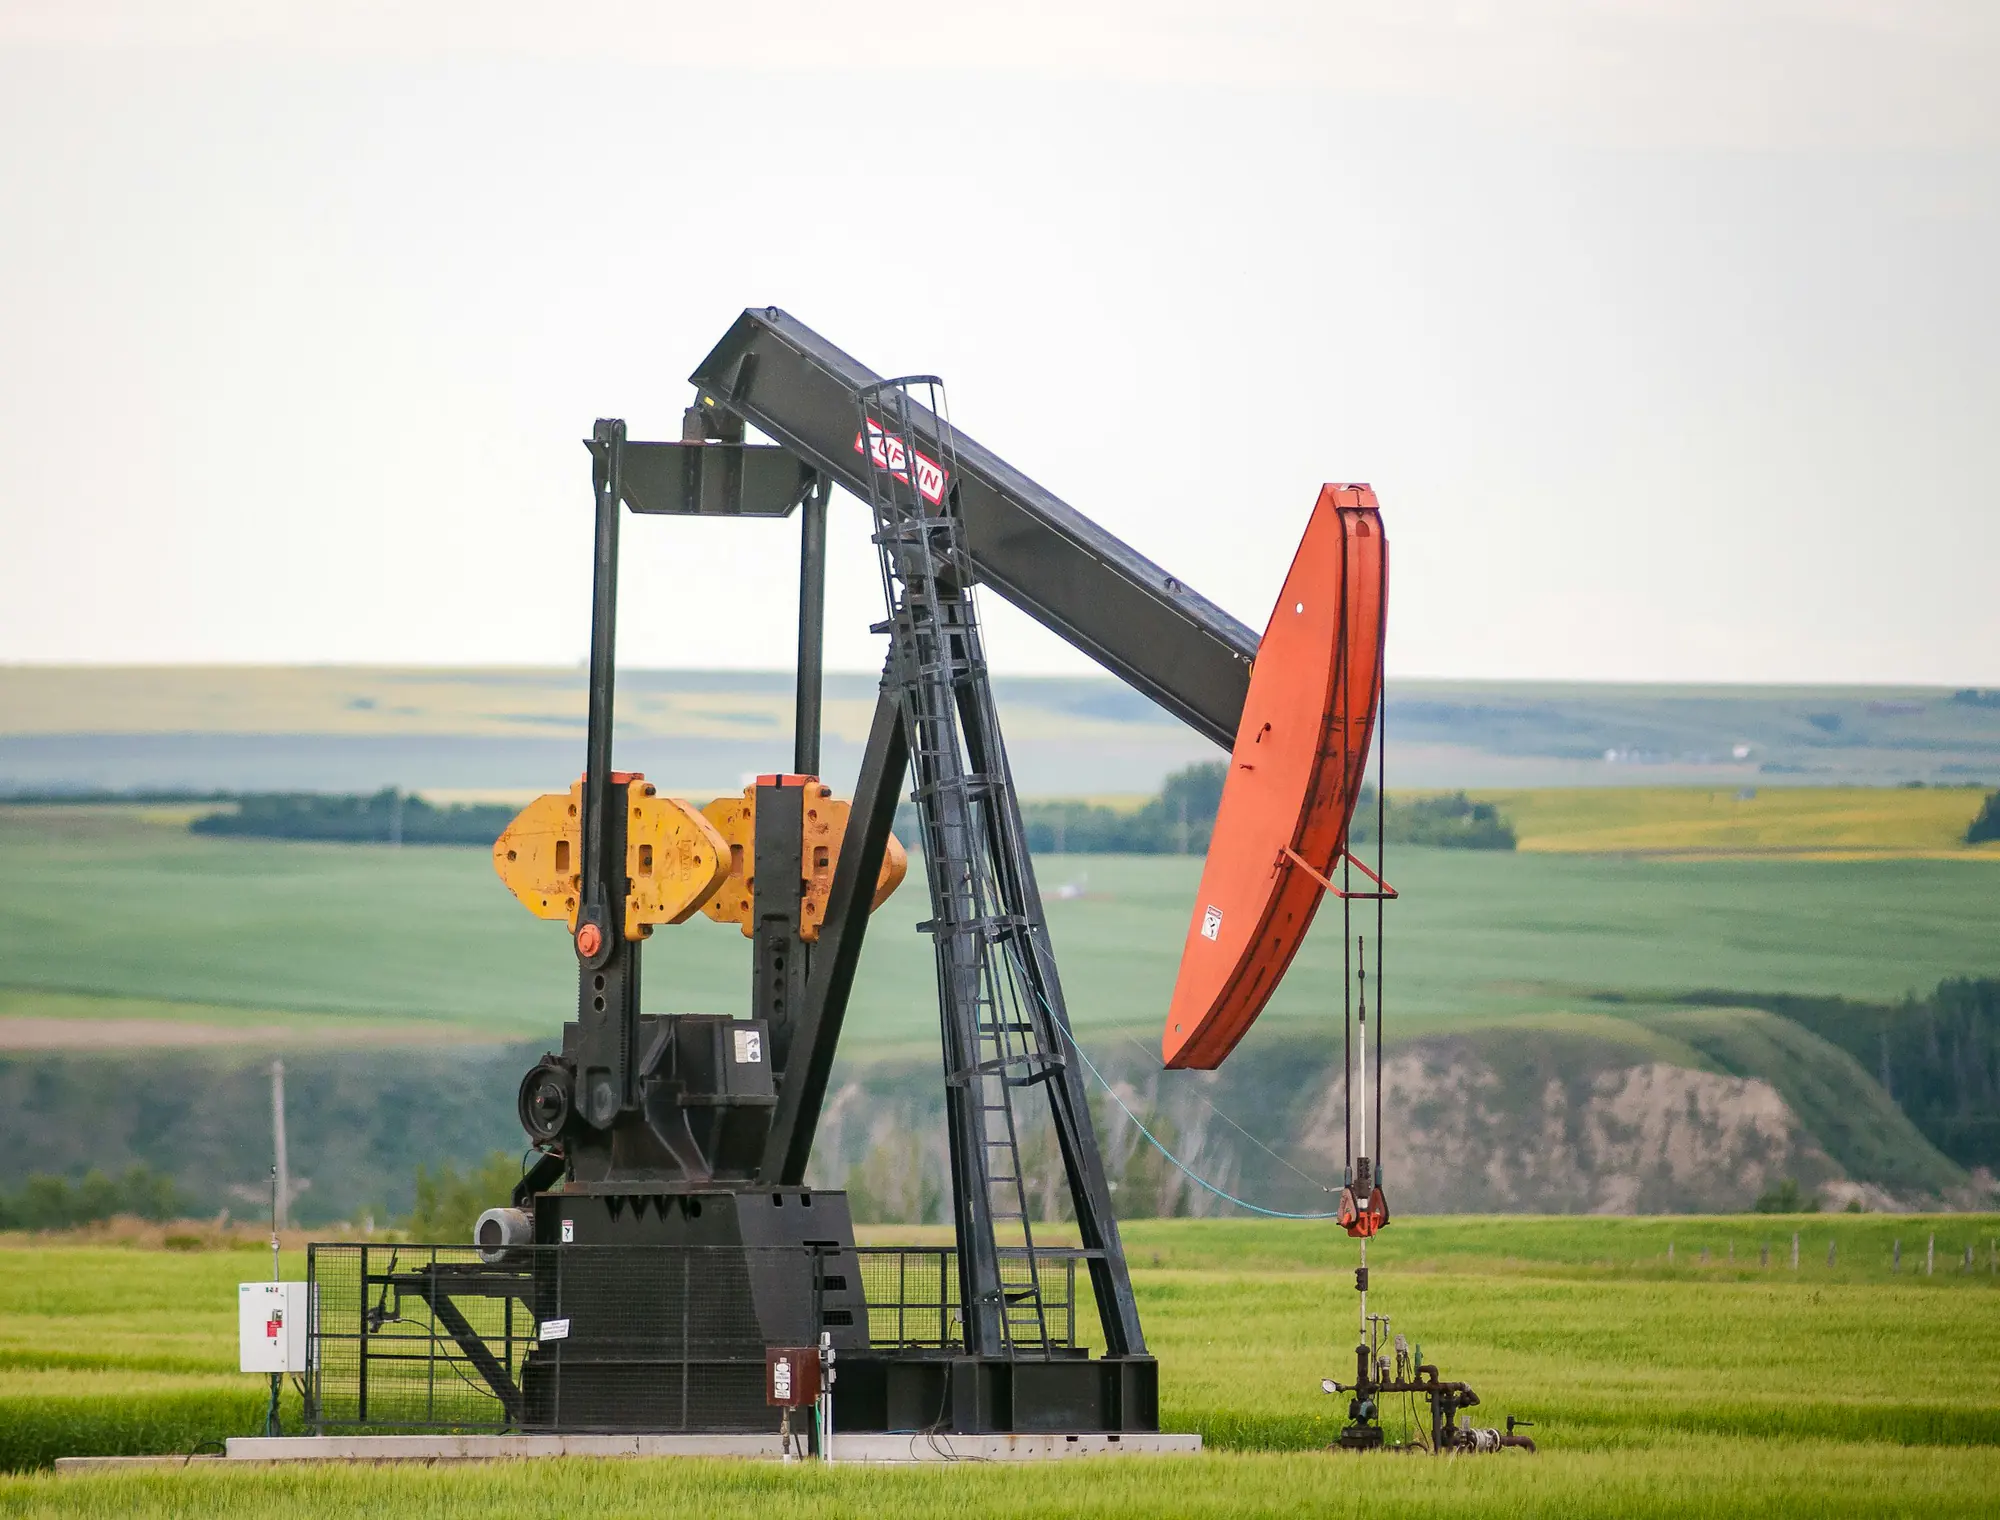

Energy Data | Colorado, US | Fix & Stabilize
Built ETL pipelines to ingest data from all 50 US states.
Unified well, production, land, and regulatory data.
Added new states without rebuilding the system.
Meter & AMI Data
Interval data ingestion, validation and estimation (VEE), gap filling, head-end integration, meter data at volume
Historians & Time-Series
Historian and SCADA integration, time-series ingestion, tag mapping, operational data out of OT and into analysis
ETL & Data Integration
Pipelines across inconsistent sources — SFTP, scraping, Excel, CSV, APIs — standardized into one reliable layer
Regulatory & Reporting Data
State and federal filing pipelines, emissions and ESG reporting, audit trails, reconciliation between systems
Three ways to get it done. Each one costs you something nobody mentions upfront.
Hiring Additional Engineers Takes Months You Don't Have
Nobody Owns The Space Between Your Systems
A New Platform Won't Fix The Underlying Data

Energy data systems span meters, historians, vendor feeds, filings, and the business systems that consume them. The strain usually shows up in how those sources hold together as volume and sources grow.
It was built for a few sources, so it breaks as they multiply.
A pipeline that worked for one state, one meter type, or one vendor feed breaks the moment you add the next format.
The data outgrows the logic that cleans it.
Validation and reconciliation that kept up in the pilot can't keep up with millions of reads across systems that disagree.
It's lost the people who understood it.
Enough hands have touched the pipelines that changes take weeks, and every fix risks breaking a downstream report.
A team who already work in this ecosystem, on the piece that's blocking you, for as long as it takes.



Your meter data and billing system don't reconcile cleanly.
Energy is delivered, but exceptions still have to be checked by hand before the bill goes out. A reconciliation layer compares both systems, flags mismatches, and gives the billing team a clear queue to resolve.
A new data source arrives in yet another format.
Each vendor, state, or system sends data its own way — SFTP, scraping, Excel, CSV, an API. An ingestion and normalization layer isolates those differences so the rest of the stack stays stable.
Your regulatory filing still depends on manual work every cycle.
Data has to be collected from several systems, checked against filing rules, and assembled by hand. A reporting pipeline collects, validates, prepares, and retains the full audit trail.
Your systems hold the same data in different forms.
Operations, finance, and reporting may all work from slightly different versions of the same information. A shared data layer standardizes those sources so everyone works from the same numbers.
You collect large amounts of data but still cannot answer operational questions.
Readings may be split between meters, historians, vendor systems, dashboards, and spreadsheets. The challenge becomes turning those sources into one reliable operational view.
Data quality problems only surface downstream, too late.
A bad read or a changed tag reaches a report before anyone notices. We trace where the data starts to diverge and add validation so the same issue is caught earlier next time.
Your team is still pulling data out of documents by hand.
Invoices, permits, statements, and regulatory documents still need someone to find and rekey the right values. An extraction workflow moves that data directly into the system where it's needed.
 Misty evergreen forest
Bring us the reconciliation that keeps failing, the filing that eats a week, or the two systems that won't agree.